When working with data in visualization tools like Tableau, Power BI, and Looker, it’s essential to prioritize fast loading times for end users. In data analytics, data often requires transformation and modeling to be usable or insightful, and adding calculated columns is a common part of this process. But where should you implement these calculated columns for the best performance? Should they go into Power BI’s front end (using DAX), Power Query, or directly at the data source (SQL Server, Excel Workbook, etc.)?
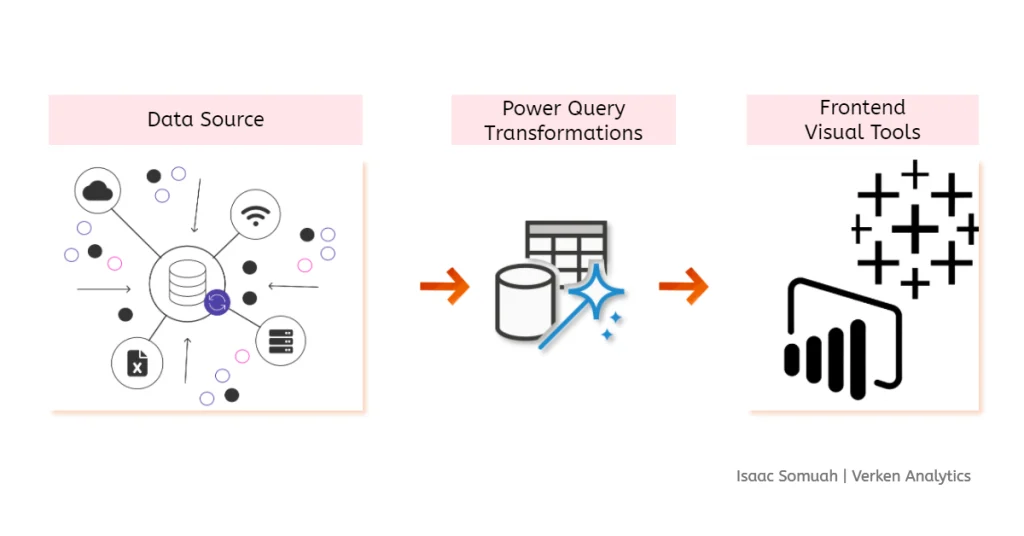
As a general rule, transformations should occur as close to the data source as possible. This practice optimizes speed and ensures that your visualizations load faster, improving performance and user experience.
Here’s a prioritized approach for where to implement calculated columns:
“Unit Price” and “Quantity,” adding this calculation directly in SQL can save time and processing power in Power BI or Tableau.“Year-to-Date Sales” in DAX makes sense because it allows for dynamic user interaction without altering the underlying data.Your familiarity with the tools also plays a role in deciding where to perform calculations. Some transformations might be easier to implement in Power BI versus Power Query, or even directly in SQL or Excel. For example, creating a “Profit Margin” calculation might feel more intuitive in Power BI for those comfortable with DAX functions, while SQL users may find it easier to do at the database level.
Your comfort level with Excel, SQL, Power Query, or DAX can influence where you perform calculations—so my advice is to learn as much of each as possible to remain flexible
Generally, it’s preferable to perform transformations in Power Query rather than DAX. Power Query processes data during the data loading stage, which optimizes report performance. In contrast, DAX calculations are evaluated during report usage, which can slow down real-time interactions, especially with complex calculations or large datasets.
Example: Say you need to create a calculated column that categorizes customers based on their total purchase amount:
Remember this order of priority when implementing calculated columns: Data Source > Power Query > Power BI Front End (DAX) > Published Reports

Next time you’re determining where to implement a transformation, consider the data source proximity and the implications for report performance. Your choice can make a significant impact on how fast and efficiently your visuals load.