Best Practices for Calculated Columns in Data Analytics Workflows

October 30, 2024
Data Transformation Workflow

When working with data in visualization tools like Tableau, Power BI, and Looker, it’s essential to prioritize fast loading times for end users. In data analytics, data often requires transformation and modeling to be usable or insightful, and adding calculated columns is a common part of this process. But where should you implement these calculated columns for the best performance? Should they go into Power BI’s front end (using DAX), Power Query, or directly at the data source (SQL Server, Excel Workbook, etc.)?

Priority for Implementing Calculated Columns

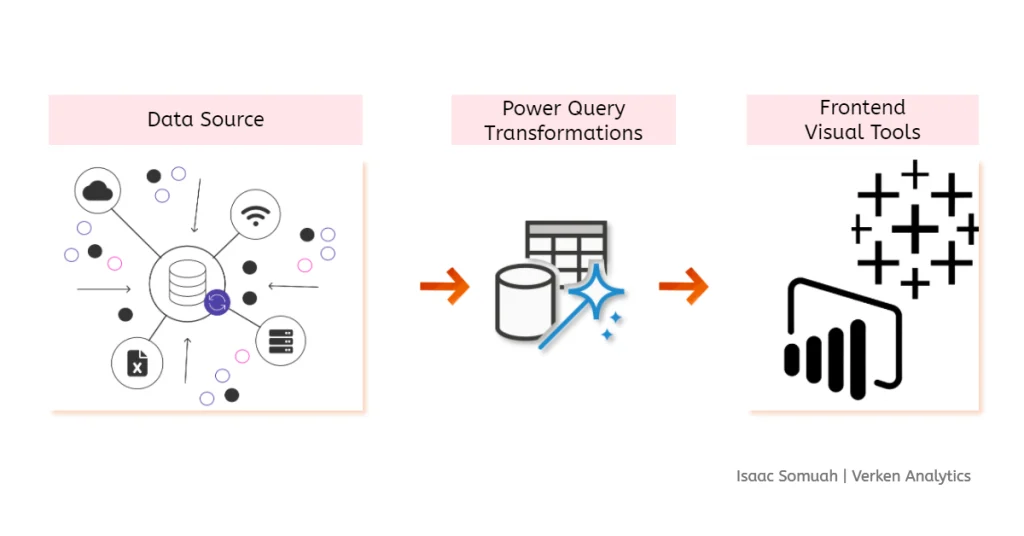
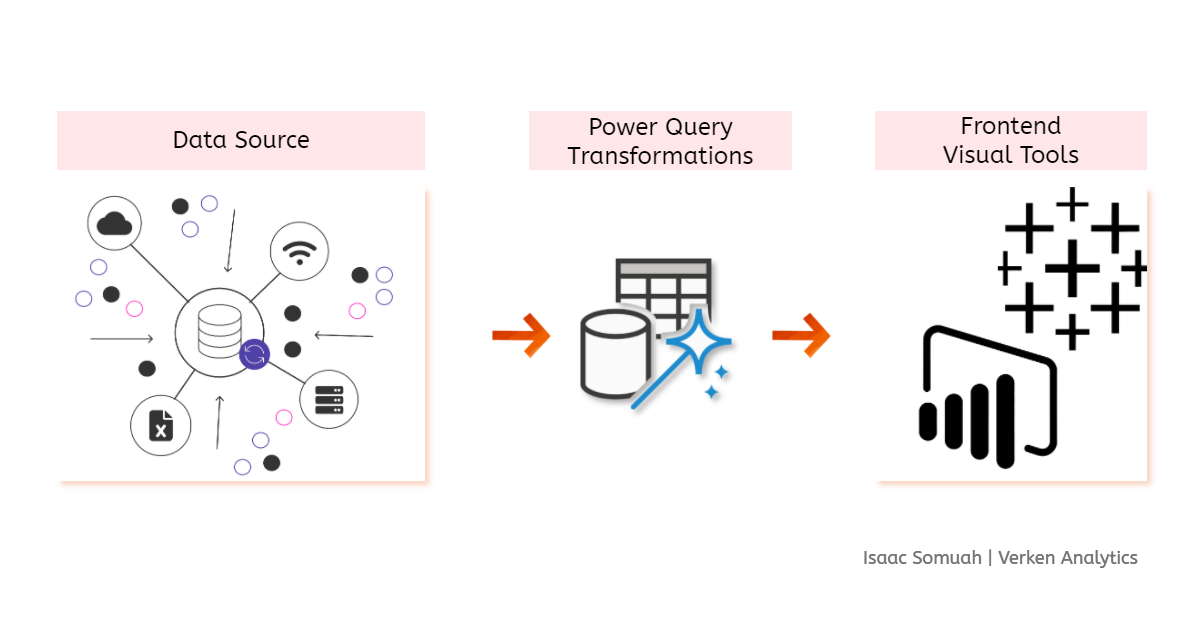
As a general rule, transformations should occur as close to the data source as possible. This practice optimizes speed and ensures that your visualizations load faster, improving performance and user experience.

Here’s a prioritized approach for where to implement calculated columns:

  1. Data Source (e.g., SQL Server, Excel):
    Implementing calculated columns directly in the data source is typically the best choice for performance. Calculations created here reduce the workload for downstream tools, allowing them to retrieve transformed data directly. For example, if you need to calculate “Total Sales” by multiplying “Unit Price” and “Quantity,” adding this calculation directly in SQL can save time and processing power in Power BI or Tableau.

  2. Power Query (ETL Layer in Power BI):
    When modifying the original data source isn’t an option, Power Query serves as an excellent alternative (Tableau Prep is another option: but……. it’s not as powerful as Power Query 😁). Power Query’s ETL (Extract, Transform, Load) capabilities can efficiently handle transformations, including calculated columns, allowing you to clean, reshape, and calculate data before it reaches the visualization layer. For example, use Power Query to create a “Sales Category” column by bucketing data based on specific thresholds (e.g., Low, Medium, High sales) – this will save you the need to use DAX for such transformation.

  3. Power BI Front End (DAX):
    DAX should generally be reserved for calculations needed directly in the visuals, such as dynamic measures or aggregations specific to certain visuals. DAX calculations are processed on the fly, so they can slow down report performance when overused. For instance, creating a measure to calculate “Year-to-Date Sales” in DAX makes sense because it allows for dynamic user interaction without altering the underlying data.

  4. Published Reports:
    Once reports are published, avoid further transformations. At this stage, your data model should be complete, and any additional calculations should be limited to what’s necessary for dynamic user interactions, like slicers or filters.

Consider Familiarity with Tools

Your familiarity with the tools also plays a role in deciding where to perform calculations. Some transformations might be easier to implement in Power BI versus Power Query, or even directly in SQL or Excel. For example, creating a “Profit Margin” calculation might feel more intuitive in Power BI for those comfortable with DAX functions, while SQL users may find it easier to do at the database level.

Your comfort level with Excel, SQL, Power Query, or DAX can influence where you perform calculations—so my advice is to learn as much of each as possible to remain flexible

Why Power Query Over DAX?

Generally, it’s preferable to perform transformations in Power Query rather than DAX. Power Query processes data during the data loading stage, which optimizes report performance. In contrast, DAX calculations are evaluated during report usage, which can slow down real-time interactions, especially with complex calculations or large datasets.

Example: Say you need to create a calculated column that categorizes customers based on their total purchase amount:

  • If feasible, add this calculation in SQL or Excel (depending on your data source) as it scales well and reduces downstream load.
  • If you can’t modify the SQL or Excel source, do this categorization in Power Query as part of data cleaning and shaping.
  • Only use DAX if the category needs to be dynamic or interact with report filters.

Summary

Remember this order of priority when implementing calculated columns: Data Source > Power Query > Power BI Front End (DAX) > Published Reports

Data Transformation Workflow

Next time you’re determining where to implement a transformation, consider the data source proximity and the implications for report performance. Your choice can make a significant impact on how fast and efficiently your visuals load.

Share via:
4 1 vote
Rate this article
Subscribe
Notify of
guest
0 Comments
Most Voted
Newest Oldest
Inline Feedbacks
View all comments

Subscribe to my Newsletter!

    WhatsApp whatsapp
    Telegram telegram
    Linkedin linkedin
    Instagram instagram
    Twitter
    chat Let's talk
    linkedin facebook pinterest youtube rss twitter instagram facebook-blank rss-blank linkedin-blank pinterest youtube twitter instagram